

(Minghui.org) An analysis of the mortality rates of the COVID-19 pandemic across different states in the U.S. revealed that a higher percentage of people died of the virus in blue states, where the democratic candidate was projected to win, than in red states that supported incumbent President Donald Trump.
This comparison included 25 red states and 20 blue states. The six states with pending recounts and legal challenges were excluded from the comparison.
The 25 red states include: Alabama (AL), Alaska (AK), Arkansas (AR), Florida (FL), Idaho (ID), Indiana (IN), Iowa (IA), Kansas (KS), Kentucky (KY), Louisiana (LA), Mississippi (MS), Missouri (MO), Montana (MT), Nebraska (NE), North Carolina ( NC), North Dakota (ND), Ohio (OH), Oklahoma (OK), South Carolina (SC), South Dakota (SD), Tennessee (TN), Texas (TX), Utah (UT), West Virginia (WV), and Wyoming (WY).
The 20 blue states are: California (CA), Colorado (CO), Connecticut (CT), Delaware (DE), Washington D.C., Illinois (IL), Maine (ME), Maryland (MD) , Massachusetts (MA), Minnesota (MN), New Hampshire (NH), New Jersey (NJ), New Mexico (NM), New York (NY), Oregon (OR), Rhode Island (RI) , Vermont (VT), Virginia (VA), Washington (WA) and Hawaii (HI).
The 6 states with unclear election results are: Arizona (AZ), Georgia (GA), Michigan (MI), Nevada (NV), Pennsylvania (PA) and Wisconsin (WI).
All data was collected from the CDC COVID Data Tracker, which reports data collected from states since January 21, 2020. If not noted otherwise, the end point of the study period was November 11, 2020.
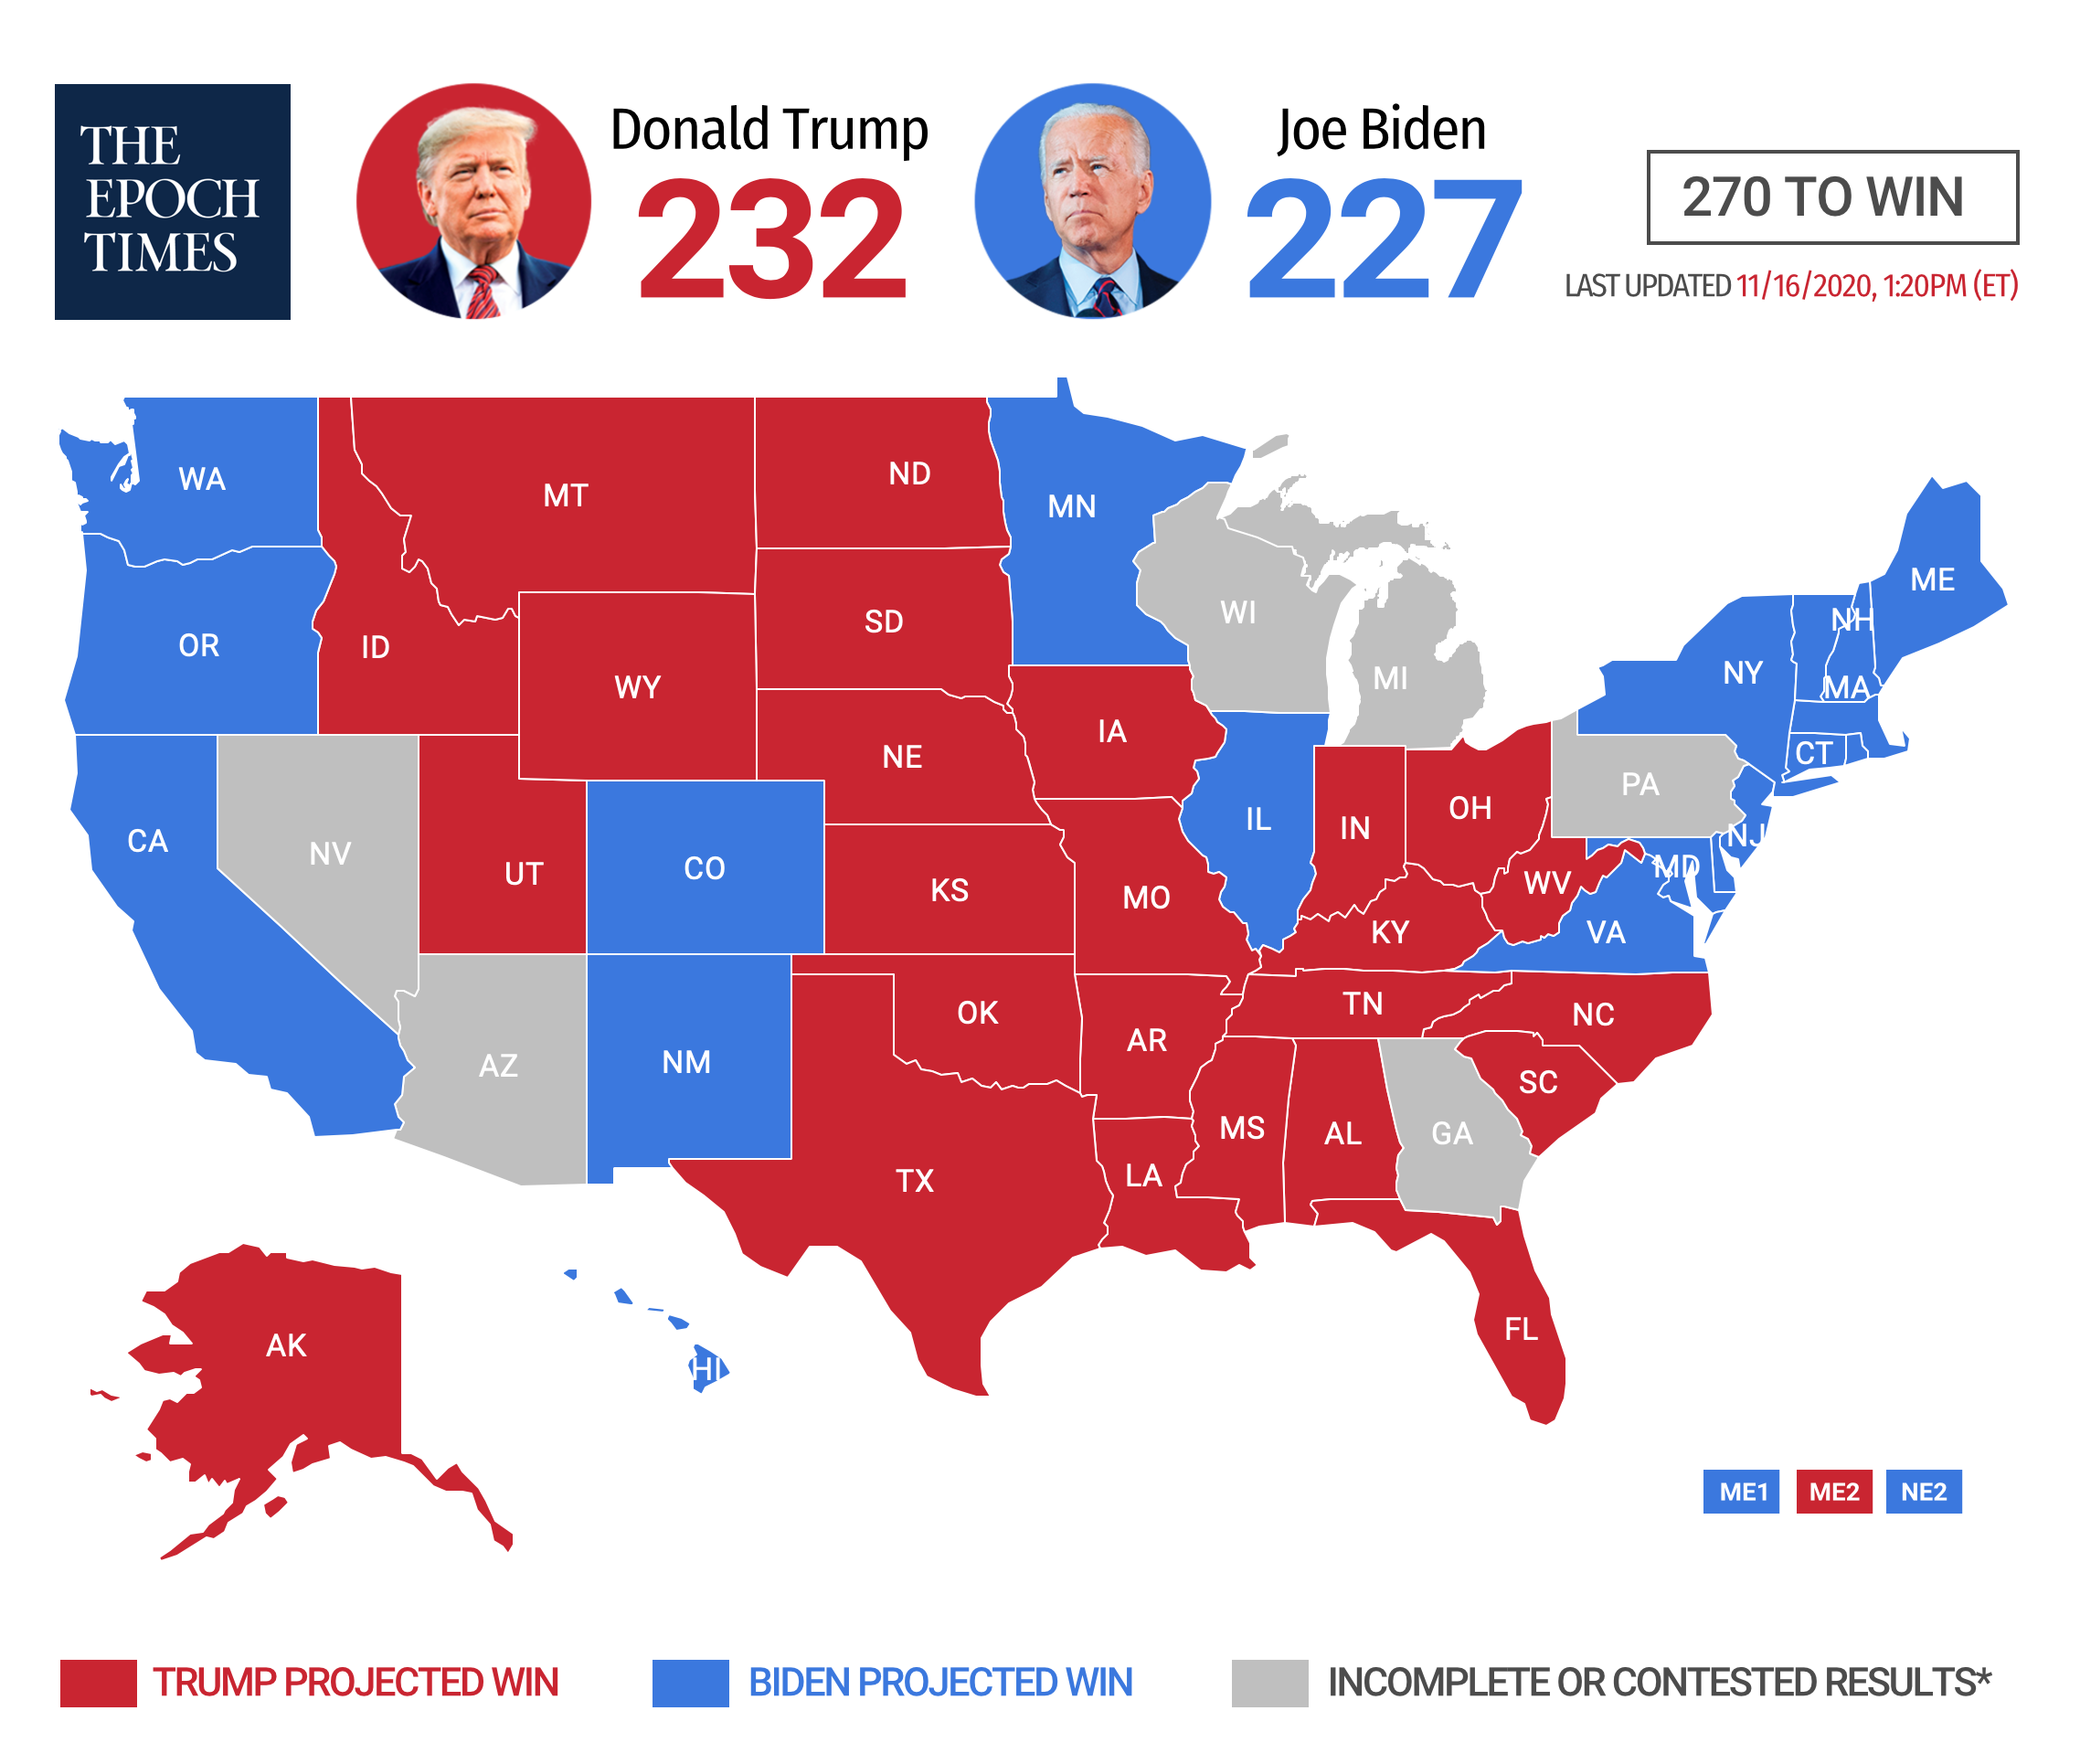 Election map produced by The Epoch Times
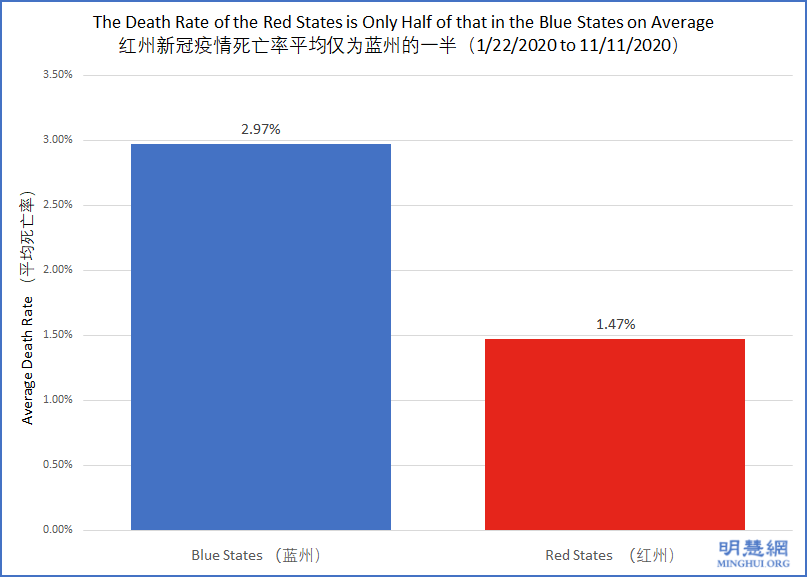 Figure 1: The blue bar represents the average death rate of blue states, where the democratic candidate is projected to win. The red bar represents the average death rate of red states, where Trump is projected to win. The death rate in each state is derived using the total COVID deaths divided by the total COVID cases in that state between January 21 and November 11, and the average is then taken across the relevant (blue or red) states.
Figure 1 indicates that the average mortality rate of COVID-19 across the 20 blue states was 2.97%, while the 25 red states reported an average of 1.47%.
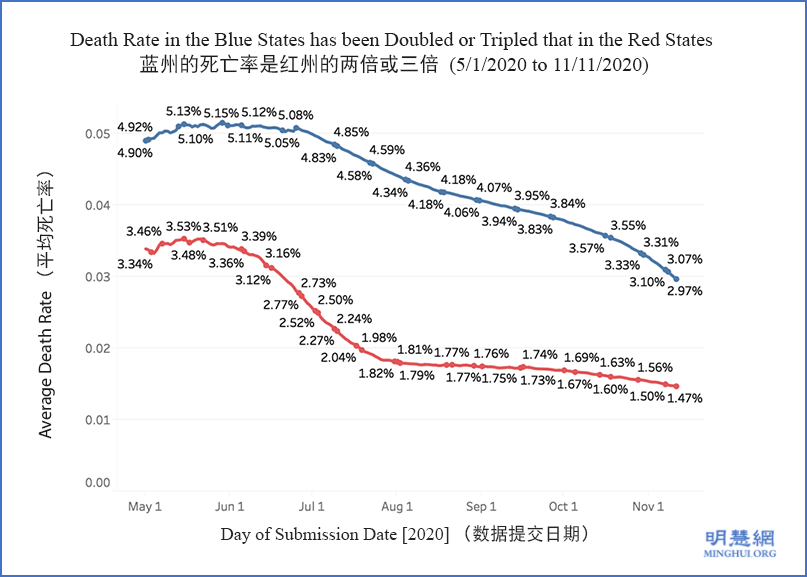 Figure 2: The solid red line represents the death rate in the red states, where Trump is projected to win, while the solid blue line represents the death rate in the blue states, where the democratic candidate is projected to win. The average death rates for blue (or red) states corresponding to each date indicated on the X-axis were calculated based on data between January 21 and that particular date. For instance, the average death rate for red states corresponding to the date of May 1 was 3.34%, which was derived by using data between January 21 and May 1.
Figure 2 offers a more dynamic view of the mortality rates. While both blue states and red states experienced mostly downward trending death rates, blue states had always reported higher rates during the study period of May to November 2020.
To reduce data bias that may arise from outliers (particularly high or low mortality rates), we have also calculated a national average of mortality rates after dropping the highest and lowest rates. This national average death rate across the remaining 43 states was found to be 2.06%. Among the 20 blue states, 10 of them (50%) had a higher death rate than the national average, while 4 of the 25 red states (16%) reported higher death rates than the national average.
Given the fact that elderly people and those with preexisting conditions are more vulnerable to the coronavirus, we also looked at demographics in different states. Take the example of the red state Iowa and blue state New Jersey, which has 17.4% and 16.5% of the population older than 65, respectively, the death rate in Iowa was only 1.1%, compared to 6.3% in New Jersey.
We also found that although the red states had more people infected with the virus, likely due to the higher total population, the death rates were nevertheless lower than those in the blue states.
While we know that the virus doesn’t have a political affiliation, such results are thought-provoking.
In the Minghui editorial “We Must Know and Be Clearheaded about Our Principles and Fundamentals,” it’s said that “This U.S. election is a battle between good and evil, a battle between gods and demons. Trump is the man chosen by the divine to return to tradition and disintegrate the Chinese Communist Party (CCP); the other side aims to destroy tradition and build the CCP’s socialism in the United States and even the world.”
Trump and his opponent represent two different value systems. In our understanding, this U.S. election has gone beyond the boundary of politics and become a choice between the two different ideologies and value systems.
In traditional Chinese culture, plagues are usually viewed as acts of Heaven, often as a warning for wrongdoing and immorality in the world. Previous reports by Minghui.org have discussed the phenomena that countries with close ties to the Chinese Communist Party are often hit harder by the pandemic.
While the election isn’t directly related to the pandemic, we believe that those states that overwhelmingly voted for Trump support his efforts to return to traditional values and fend off the corrupting influence of communism. In turn, their opposition to communism and support for traditional values can protect them from the virus.
Category: Perspective
